Monthly Archives: September 2017

Hurricane Irma Will Be Dangerous No Matter Where It Makes Landfall

Hurricane Irma could make the 2017 Atlantic hurricane season a historic one. The storm is currently barreling toward Florida as a Category 5 hurricane, with maximum sustained winds of 185 mph. Over the next 12 to 24 hours, the Leeward Islands, Puerto Rico and the U.S. Virgin Islands are likely to bear the brunt of the storm. And the U.S. mainland is in its path.

The National Hurricane Center’s five-day outlook forecasts that on Sunday afternoon, Irma will be just south of the Florida Keys as a powerful Category 4 hurricane, with maximum sustained winds of about 140 mph. Such a storm could come ashore in the state with heavy rain and a potentially devastating storm surge.

The last Category 4 storm to hit Florida was Hurricane Charley in 2004. While cutting across central Florida, the storm directly or indirectly killed 33 people and caused billions of dollars in property damage. If Irma’s projected track is accurate, the hurricane would probably also be costly and deadly.

But it’s still too early to know whether Irma will make landfall in the U.S. mainland or where that could occur. Despite big strides in forecast accuracy over the last 27 years,The data on this webpage showing annual average forecasting error for tropical cyclones starts in 1989.

‘>1 the National Hurricane Center’s five-day forecast comes with a wide margin of error. An average five-day track forecast is off by greater than 200 miles. That’s over 60 miles wider than the distance from St. Petersburg on the western coast of Florida to Vero Beach on the east.

You can get an idea of why the error range is so wide by looking at all the paths that different hurricane models say Irma could take. Take a look at this group,Note that there are more models than those plotted here. This is just for reference.

“>2 plotted by the South Florida Water Management District, for example:

Although they’re not the only tools that meteorologists use to try to figure out the most likely path of a hurricane, these models are one of the most important. And you can see the variation among them: Some show the storm heading east of Florida and into the Carolinas or out to sea, while a few take the storm over CubaWhich could weaken the storm before hitting the U.S. mainland.

“>3 and into the Gulf of Mexico.

So, if we combine the numerous paths that the models project with the historical forecast error five days out, the storm’s eventual path is still far from clear.

That’s why the hurricane center publishes a cone of uncertainty.

NOAA / NATIONAL WEATHER SERVICE

The error cone exists not out of an abundance of caution by a government agency but because of real mathematical uncertainty about where the storm will go. A track that takes Irma east or west of the Florida Peninsula — and anywhere in between — is still possible.

The most likely track, however, remains the center of that cone, which currently passes very close to the Florida Keys. That’s why the National Hurricane Center specifically mentions that the likelihood of “direct impacts from Irma beginning later this week and this weekend from wind, storm surge, and rainfall continues to increase in the Florida Keys and portions of the Florida Peninsula.”

Even if the forecasts about Irma’s path end up being accurate, the storm is unlikely to be a Florida version of Hurricane Harvey, which devastated Southeast Texas and southwestern Louisiana over the last few weeks with days of heavy rainfall. Unlike Harvey, Irma, at this point, is not expected to stall over the same area for a long period of time. And that means Florida wouldn’t get the tremendous amount of rain that Harvey dropped on Houston (although Irma could still spread a lot of rain over an even wider area).

But Harvey and Irma may join the history books together. Irma could make landfall in the continental U.S. as a Category 4 storm, as Harvey did in August. Since 1851, there hasn’t been another year in which two Category 4 storms have directly affected the continental U.S. The Atlantic Oceanographic and Meteorological Laboratory points out that record-keeping for some of the smaller and older storms isn’t perfect, but regardless, two Category 4 storms hitting the U.S. in the same season would be very rare.

For now, people in the southeastern U.S. need to keep an eye on Irma. And people in southern Florida should start preparing for a possible impact. Key West has already ordered a mandatory evacuation of residents starting Wednesday night.
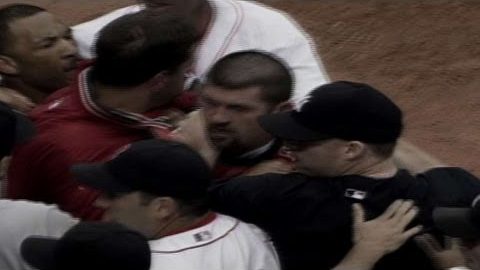
The Red Sox-Yankees Rivalry Hasn’t Mattered This Much In A Decade

On Sunday night, the Boston Red Sox and New York Yankees are playing their final game of the regular season, and the stakes are still high: New York is 4.5 games behind Boston in the American League East, and it’s also leading the wild-card race by 1.5 games. Boston needs to hold the Yankees at bay in the division, plus it’s jockeying with the Cleveland Indians for seeding and home-field advantage in the playoffs. When the season concludes in a few weeks, the results of this series, in which the Yankees have won two of three so far, could be a deciding factor in the AL’s playoff picture.

Oddly, that’s been unusual for the Red Sox and Yankees of late. Given the hullabaloo surrounding this rivalry, one would think that the fate of baseball as we knew it hung in the balance each time the pair met. But lately these games have been pretty irrelevant in the big picture. We can see this by looking at The Baseball Gauge’s Championship Leverage Index (CLI), which uses the change in a team’s World Series odds to measure the championship implications of a given game, relative to an average opening-day contest.Specifically, it uses the average opener during the two-wild-card era, which started in 2012, as a baseline.

‘>1 This year’s average Red Sox-Yankees game has been nearly 70 percent more important than that baseline,Before this series began.

“>2 and that’s easily the most significant the rivalry has been in a dozen years. From 2007 to 2016, the typical Yanks-Sox contest was only about as important as any old opening-day game. In other words, it was fun but no big deal.

According to CLI, the Red Sox-Yankees rivalry reached its peak in the mid-2000s, when the two teams were battling for the AL East every regular season and occasionally in the playoffs — a faceoff we can’t rule out this year. From 2003 to 2006, 39 regular-season matchups between Boston and New York (or slightly more than half of all games in the rivalry for those years) were at least 50 percent more important than a run-of-the-mill game. In 2005, when the clubs tied for the division’s best record,The Yankees won on a tiebreaker.

“>3 the average contest between them was a staggering 116 percent more important than an ordinary ballgame. Those were the days when the rivalry most lived up to its bitter reputation.

Oddly, the 2004 regular season — which gave us moments like the brawl between Jason Varitek and Alex Rodriguez — contained some of the rivalry’s least meaningful games of that era, since six of their 19 contests came in September, when both teams had already locked down playoff spots. They more than made up for those unimportant games in the playoffs, of course.

But in recent years, Yankee-Red Sox games have tended to carry far fewer postseason implications. We haven’t seen both teams make the playoffs in the same season since 2009, as the Yankees missed out in three of the past four years and the Red Sox have been wildly fluctuating between great and terrible seasons on an almost yearly basis since their record-breaking collapse of 2011. In the decade from 2007 to 2016, there were only 28 games between the rivals that had a championship leverage 50 percent higher than an ordinary contest, an average of fewer than three per season. For comparison, an average of nearly 10 Boston-New York games per season hit that threshold from 2003 to 2006. Thanks to retiring legends, off-field drama and a drop in buying power for baseball’s richest teams,Or at least, what appeared to be less of an advantage for rich teams. In recent seasons, there’s some evidence that high-payroll clubs might be making a comeback.

‘>4 the Red Sox and Yankees went from the game’s finest feud to just another set of divisional games.

This season, though, the rivalry is back. Boosted by a crop of impressive young stars on each side, New York and Boston have played more meaningfulDefined as a game with at least 50 percent more importance than the average opening-day matchup.

“>5 contests in 2017 than they did in the previous seven seasons combined.

For fans who reveled in the bad blood between the likes of Pedro Martinez, Don Zimmer, Karim Garcia, Roger Clemens and Manny Ramirez, that means the glory days might come back soon enough. Indeed, our Elo ratings think this year’s Yankees are roughly as good as the 2004 edition was at the same stage of that season, and that the Red Sox are about halfway between the 2003 and 2004 versions, quality-wise. We may not be guaranteed to get the same playoff drama as we got in this rivalry’s heyday, but we’re already off to a strong start.

Hurricane Harvey’s Impact — And How It Compares To Other Storms

Hurricane Harvey, which dumped an estimated 27 trillion gallons of water on Texas and Louisiana, looks to be one of the most damaging natural disasters in U.S. history. Flooding continues to affect large areas of Houston, Beaumont and other areas of Texas. Tens of thousands have been forced to evacuate their homes, and rig shut downs and evacuations along the Gulf have curbed oil and gas production. The White House, meanwhile, is expected to ask Congress for $14.5 billion in relief funding. While we don’t know Harvey’s ultimate toll on life and property — and won’t for some time — here are the best estimates of the hurricane’s impacts so far, and how they compare to the destruction wrought by other major storms.

Economic impact

Estimates of Harvey’s cost vary, with some predicting that the storm will be the most expensive in U.S. history at over $190 billion, surpassing Hurricane Katrina. (The National Oceanic and Atmospheric Administration estimates Katrina to have cost around $160 billion.) If that ends up being the case, it would greatly increase the total cost of billion-dollar-plus events since 1980. Others predict that the cost will be closer to that of Superstorm Sandy, at around $70-90 billion.

In general, hurricanes are a particularly devastating type of natural disaster. Of the billion-dollar disasters shown in the chart above, the 10 most destructive hurricanes caused an estimated $442 billion in losses, over a third of the $1.2 trillion caused by all 212 events combined. And while billion-dollar hurricanes haven’t been growing more frequent, Harvey and other super damaging weather and climate disasters are part of a continuing, costly trend.

Rain and flooding

One reason for Harvey’s estimated record cost is the sheer amount of rain and flooding brought on by the storm. Harvey set the record for tropical cyclone rainfall measured in any one place in the U.S. over at least the past 50 years.

Since its landfall on Aug. 25th, Harvey also brought extensive flooding in and around Houston and Beaumont before it dissipated and made its way inland.

Because of Harvey’s flood impacts, many have compared it to Hurricane Katrina. Katrina’s devastation was a result of the failure of government flood protection systems, violent storm surges, a chaotic evacuation plan and an ill-prepared city government. Harvey, on the other hand, has caused massive flooding at a slower pace, without Katrina’s deadly surge. In this way it resembles other costly and damaging tropical cyclones of the past 30 years.

The most expensive and fatal tropical storms

Billion-dollar tropical cyclones that made landfall in the U.S. since 1980

START DATE TROPICAL CYCLONE EST. COST EST. DEATHS
1 Aug. 25, 2005 Hurricane Katrina $160.0b 1,833
2 Oct. 30, 2012 Hurricane Sandy 70.2 159
3 Sept. 20, 2005 Hurricane Rita 23.7 119
4 Sept. 12, 2008 Hurricane Ike 34.8 112
5 Sept. 21, 1989 Hurricane Hugo 18.2 86
6 Sept. 14, 1999 Hurricane Floyd 9.7 77
7 Oct. 27, 1985 Hurricane Juan 3.5 63
8 Aug. 23, 1992 Hurricane Andrew 47.8 61
9 Sept. 12, 2004 Hurricane Ivan 27.1 57
10 Sept. 18, 2003 Hurricane Isabel 7.4 55
11 Aug. 31, 2008 Hurricane Gustav 7.0 53
12 Oct. 8, 2016 Hurricane Matthew 10.3 49
13 Sept. 3, 2004 Hurricane Frances 12.9 48
14 Aug. 25, 2017 Hurricane Harvey* 81-108 47
15 Aug. 26, 2011 Hurricane Irene 15.0 45
16 June 5, 2001 Tropical Storm Allison 11.9 43
17 Sept. 5, 1996 Hurricane Fran 8.0 37
18 Oct. 24, 2005 Hurricane Wilma 24.3 35
19 Aug. 13, 2004 Hurricane Charley 21.1 35
20 July 7, 1994 Tropical Storm Alberto 1.7 32
21 Sept. 15, 2004 Hurricane Jeanne 9.9 28
22 Oct. 4, 1995 Hurricane Opal 7.6 27
23 Sept. 1, 2011 Tropical Storm Lee 2.8 21
24 Aug.17, 1983 Hurricane Alicia 7.5 21
25 Aug.18, 1991 Hurricane Bob 2.7 18
26 Sept. 20, 1998 Hurricane Georges 9.1 16
27 July 9, 2005 Hurricane Dennis 3.2 15
28 Sept. 15, 1995 Hurricane Marilyn 3.4 13
29 Aug. 7, 1980 Hurricane Allen 1.9 13
30 Sept. 26, 1985 Hurricane Gloria 2.0 11
31 Aug. 26, 2012 Hurricane Isaac 3.0 9
32 Sept. 11, 1992 Hurricane Iniki 5.5 7
33 Aug. 30, 1985 Hurricane Elena 3.0 4
34 July 23, 2008 Hurricane Dolly 1.5 3
35 Aug. 27, 1998 Hurricane Bonnie 1.5 3
36 Aug. 1, 2002 Hurricane Lili 1.5 2

*The full scope of Hurricane Harvey’s impact and cost are not yet known. The estimated cost range is from Moody’s Analytics. Texas officials estimated Harvey has caused at least 47 deaths, according to the New York Times. Both estimates are as of Sept. 1, 2017.

Sources: National Oceanic and Atmospheric Administration, Moody’s analytics, New YOrk Times

Other impacts to look out for

The immediate effects of Harvey were also felt by the oil and gas industries. Around 10% of manned oil platforms in the Gulf were evacuated, according to the Bureau of Safety and Environmental Enforcement. While the fallout is still being determined, gas prices have risen and oil and gas rig production has continued to be hampered.

There are many more consequences that residents and officials are only now sorting through. Harvey’s impact may be felt as residents seek claims from insurance companies, encounter environmental contaminants from debris and infrastructural damage and incur the economic effects of displacement. The cleanup has only just begun.

MLB’s Prospects Are Showing Up Ready To Mash

Philadelphia Phillies first baseman Rhys Hoskins arrived in the majors on August 10. By August 27, he had 11 home runs, including eight in nine days, and was already being declared the savior of the franchise. But we had seen this story unfold once already this summer. In late April, Los Angeles Dodgers outfielder Cody Bellinger arrived in Chavez Ravine, where he started hitting dingers at a historic rate and basically never stopped.

This isn’t supposed to happen in MLB. Call-ups from the minors often look overwhelmed and out of sorts when facing big league pitching for the first time — if not immediately, then at least at some point in their first month. But that’s not the case this season. Rookies are contending for MVP awards, young hitters across the league are mashing at a ridiculous rate and minor league prospects aren’t missing a beat when earning a first-time call-up.

There’s evidence that this is not necessarily because today’s young hitters are just better than previous years’ crops, but rather because ballclubs are armed with new technologies, which is making them better at determining which players are ready for the majors and when.

This skill is more important now than at any other time in the baseball calendar. Teams gained an additional 15 roster spots on Friday, which they often fill with players from the minors. About 20 percent of call-ups happen in September, and teams usually bring promising prospects up for a preview. That means we get a chance, if only for a brief moment, to see some of the best talent from each team’s farm system.

Hitters called up for the first timeThis category overlaps with rookies, but since rookie status is determined by service time, not all rookies are first-time call-ups.

‘>1 used to lag behind their more experienced colleagues. Each year from 2009 to 2014, the median batters in this group were typically below replacement level for the season. But since 2015, the same group has posted substantially higher WAR, in terms of both average and median, and these players now easily meet or (more often) exceed replacement level.

Here’s a chart showing the average wins above replacementUsing Baseball Prospectus’s version of the stat.

“>2 of first-time call-ups by year.

The youngsters have built some of that value with the bat. From 2009 to 2014, first-time call-ups averaged a .218/.278/.336 slash line. An era of low offense didn’t help, but even compared to the league as whole, they were swinging poorly. Since 2015, first-time call-ups have improved to .234/.296/.363.

But the slash lines can be a little misleading. When we look closer, it becomes clear that the post-2015 group of players derives some of its advantage from performing better in the first few months of their major league careers. It seems likely that recent batches of call-ups have been more ready to hit big league pitching when they first arrive, rather than scuffling for weeks as they adjust to higher pitch speeds and better pitcher control.

It doesn’t appear to be a coincidence that this shift happened in 2015. The TrackMan system, which tracks crucial elements of hitting performance like exit velocity and launch angle, started to measure the minor leagues in 2010, but it wasn’t widely used across baseball until 2014 or 2015. Equipped with precise information about how each batted ball was hit, teams can now base their promotions and call-ups on more than just gut feel and minor league outcomes.

This is probably doesn’t affect star rookies much. After all, it doesn’t take a fancy tracking system to be able to see that someone like Mike Trout or Bryce Harper is pretty good at baseball and deserves a chance at the next level. Where TrackMan might be most useful is for telling who isn’t up to the challenge of major league baseball. While there are occasional exceptions, batters who can’t regularly muster exit velocities close to the MLB average will struggle to produce offensively. TrackMan offered a way for teams to screen those weaker hitters out. And just as expected, since 2014, the fraction of hitters with below-replacement-level value in their first year in the majors has dropped.

The downside to TrackMan has been that players come in as mature products without the room for growth they once had. Before the advent of radar tracking, players showed a clear learning curve: Between their first 10 games in the majors and their 40th-50th, they gained an average of 92 points of OPS. Since 2015, that improvement has been much more muted, at only 47 points. The performance of the pre- and post-TrackMan era call-ups eventually converges, suggesting that much of the value that recent call-ups produce comes shortly after they join the majors.

All that new information might have revolutionized how teams evaluate hitters, but it is much less useful for gauging pitchers. Hurlers don’t have as much control over how hard the ball is hit, or at what angle. Instead, the equivalent technology for pitchers is probably Pitchf/x, which was adopted in MLB in 2007 and measures such crucial characteristics as the velocity and break of pitches. Pitch tracking came into wide use in the minors in 2009, which coincides with a noticeable bump in rookie production. Young pitcher WAR totals have stayed relatively constant since then, so teams don’t seem to have built on whatever initial advantage Pitchf/x might have brought.

Whether it’s baseball’s first scouting reports or the quantification of a batter’s swing, fresh data has frequently changed the balance of power between veterans and youngsters in the league. As the influx of technology at the major league level makes its way to the minors, the information gap between MLB and Triple-A will start to close. And as the risk that a call-up will flame out decreases, the league might soon be taken over by players in their early 20s making the job look easy.

Michigan’s Lineup Was Gutted. How Much Will It Matter?

Jim Harbaugh has restored Michigan’s place in the upper ranks of the college-football hierarchy with two straight 10-win seasons. As the team kicks off its 2017 campaign on Saturday against the 17th-ranked Florida Gators in Arlington, Texas, the Wolverines will bring a new sense of optimism and Harbaugh-infused intensity. There’s one thing they won’t bring, though: Many of last year’s players.

Michigan, which is ranked 11th to start the season, is perhaps the hardest team in college football to get a read on — and not just because Harbaugh refused to release his team’s official roster until Wednesday. The team was one of the best in the nation last season but sustained heavy personnel losses in the offseason, saying goodbye to seven starters on offense and a staggering 10 on defense. According to college football information guru Phil Steele’s team experience rankings, Michigan ranks 127th out of 130 teams this year. As you might expect, teams who lose numerous starters tend to take a step back the following season — no matter how good the incoming recruits are.

With only five starters coming back, Michigan is returning less of its lineup than any other team in the country. And indeed, among Power Five schools since 2001, only Arkansas in 2004Which returned only four starters.

“>1 brought back a less experienced lineup than the Wolverines, according to data we obtained from Steele. It’s no coincidence that those Razorbacks finished with a losing record after winning nine games the year before, because there’s a pretty clear relationship between how much talent returns to a team and how well it does that season. Using Steele’s data,Including seasons going back to 2008, when information on returning quarterbacks is complete.

“>2 I ran a regression and found that every additional starter lost on offense shaves about one-fifth of a win off of a team’s recordPer 12 games, against a neutral schedule.

“>3 — and that’s if none of those starters played quarterback. Losing a starting QB costs a team about three-fifths of a win per season.

Here’s how the number of starters lost would be expected to affect an average FBS team (according to ESPN’s team efficiency ratings, which grade a team on each side of the ball on a 0 to 100 scale, with 50 as average):

For a team like Michigan, which notched a (well-above-average) offensive rating of 73.7 last season, the loss of seven offensive starters projects to drop their offensive rating to 63.0 — only about as good as Mississippi State or Colorado State was last season and 7.2 points lower than it would have been if Michigan had the FBS’s average number of non-quarterback starters coming back.In 2017, that average number is 6.1.

“>4

That alone would figure to cost the Wolverines a half-win this season relative to average, but the losses on defense could be even more damaging. In Steele’s data set, only one other Power Five team — the 2010 Minnesota Gophers — lost 10 of 11 defensive starters between seasons, and that team’s defensive rating dropped from 58.9 to 22.2. Not every team with defensive losses sees quite so steep a drop-off, but here’s how the number of departing starters tends to affect a defense:

Michigan’s defense carried an 87.4 rating last season, third-best in the FBS, but my model predicts that they’ll drop to 62.8 — basically the same as last year’s Texas A&M and Penn State outfits — after turning over nearly the entire starting corps. (Only linebacker Mike McCray is back from last year’s starting lineup on D.) Even accounting for the fact that the typical defense loses about 4.5 starters per season, the Wolverines figure to be down 0.9 more wins than average because of their many defensive departures.

Add it up, and Michigan’s inexperience has unquestionably caused it to lose ground relative to the rest of the country.

But fear not, Ann Arbor. This doesn’t mean that Michigan will immediately plummet back to the depths it reached under Rich Rodriguez and Brady Hoke after briefly coming up for air with Harbaugh. The Wolverines have some important factors working in their favor, according to the model.

Although losing a bunch of players hurts, the single most damaging starter a team can wave goodbye to is its starting quarterback — and Michigan’s incumbent QB, Wilton Speight, is still around this season. (He may not start, but even that might be a positive sign if Harbaugh has another QB on hand that he believes is as good as a returning starter.) Returning a QB can boost a team’s offensive efficiency rating by about 8 points, which is enough to offset the loss of about 3.5 non-QB starters by itself.

Another important factor is playing in a Power Five conference. Because a top conference such as the Big Ten perennially dominates the recruiting rolls, its schools always have a deep talent base, which in turn makes them much better equipped than smaller programs to weather a mass exodus of players. When I combined efficiency ratings on both sides of the ball, I found that a Power Five team can expect to win about one more game (against a neutral schedule) than a school not in a Power Five conference, even after controlling for starters lost. Considering how good Michigan’s recruiting has been under Harbaugh, the Wolverines’ next crop of starters should help them survive the loss of the previous one.

And, finally, there’s Harbaugh himself. According to my model, teams that bring back a head coach tend to gain nearly a half-win on teams that break in a new one, after controlling for all of the other factors mentioned. Continuity is huge in a sport like college football, in which the status quo reigns supreme — as long as nothing upsets the apple cart too much. Having a consistent system can help player development, for instance, as recruits have the benefit of learning the playbook over the course of multiple seasons. And Harbaugh has to rank among the better coaches in the sport today, having turned around Stanford and Michigan from a combined 6-18 record in the seasons before he arrived to a combined 22-4 in his most recent campaigns with each school. (Not to mention bringing the San Francisco 49ers one first-and-goal touchdown away from a Vince Lombardi trophy.)

Harbaugh is a bit of an, um, eccentric coach, and — including his stint in the NFL — he has a tendency to burn his teams out after several seasons of rapid improvement. But for now, he still has Michigan in the ascending phase. In other words, the odds are still high that the Wolverines take a step backward this season, but the drop might not be as steep as it could have been.